-
Line Profiler - Profile python code execution time (example)연구/Python 2020. 9. 9. 14:28

주로 사용하는 Python profiler인 Line Profiler를 Example과 함께 간단히 소개합니다.
Line profiler 설치
pip install line_profilerExample code : conv2d, batchnorm2d, relu 로 이루어진 간단한 network를 만들었습니다.
import torch
import torch.nn as nn


@profile
def convmodel(netwrok, input, iter):
	for i in range (iter):
		out = network.conv2d(input)
		out = network.bn(out)
		out = network.relu(out)
	return out

if __name__ == '__main__':
	input = torch.randn(1,32,64,100)

	network = nn.Sequential()
	network.add_module('conv2d', nn.Conv2d(32,64,(3,3),(1,1),bias=True))
	network.add_module('bn', nn.BatchNorm2d(64))
	network.add_module('relu', nn.ReLU())

	iteration = 10
	out = convmodel(network, input, iteration)
Profile하기 원하는 Definition 위에 @profile으로 decorate
@profile
def convmodel(netwrok, input, iter):
	for i in range (iter):
		out = network.conv2d(input)
		out = network.bn(out)
		out = network.relu(out)
	return out
Kernprof~ 를 하면 .lprof 파일이 생성됩니다.
kernprof -l -v test.py이때 위의 코드처럼 -v option을 추가하면 .lprof파일이 생성됨과 동시에 결과를 바로 확인할 수 있습니다.
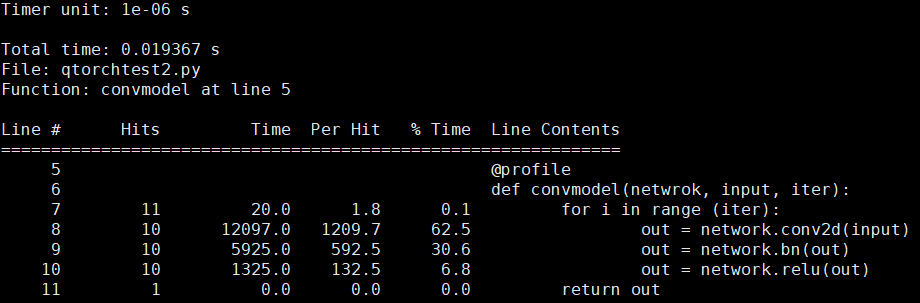
Profile result 실행하면 위와 같은 화면을 볼 수 있습니다. conv2d가 1209.7us로 definition의 전체 시간 중 62.5%를 차지하네요.
각 Line별로 해당 Line을 몇번 Hit했는지, 얼만큼의 시간을 사용했는지 직관적으로 표시되어 있습니다.
자세한 설명은 아래를 참고하세요.
- Line #: The line number in the file.
- Hits: The number of times that line was executed.
- Time: The total amount of time spent executing the line in the timer's units. In the header information before the tables, you will see a line "Timer unit:" giving the conversion factor to seconds. It may be different on different systems.
- Per Hit: The average amount of time spent executing the line once in the timer's units.
- % Time: The percentage of time spent on that line relative to the total amount of recorded time spent in the function.
- Line Contents: The actual source code. Note that this is always read from disk when the formatted results are viewed, not when the code was executed. If you have edited the file in the meantime, the lines will not match up, and the formatter may not even be able to locate the function for display
lprof 파일만 읽기
python -m line_profiler test.py.lprofReference
https://github.com/rkern/line_profiler
rkern/line_profiler
(OLD REPO) Line-by-line profiling for Python - Current repo -> - rkern/line_profiler
github.com